The monitoring stack in my home network depends on a lot of pieces of software all configured to be up and ready every time I have to reboot the gateway (a 8GiB Raspberry Pi 4). One piece of software who, for a while, did not play nice was Prometheus.
(For those just looking for my answer, it’s in the last paragraph).
## The setup
Essentially, my statistics front-end is running on the VPS that serves my website. It, and my gateway, are both members of a VPN (as in an actual virtual private network). When my gateway comes online, it connects automatically to my VPS (the VPN’s gateway), and Grafana can pull data from it from within the VPN (removing the need to expose my raspberry pi to the wild internet). Similarly, the prometheus database in that stack can pull data from the exporters installed on various machines within my VPN, including the gateway.
## The issue
I decided early on that having prometheus’ node exporter expose metrics on every interface was not necessarily advantageous. It could lead to a leak of information from anyone who got access to the network above mine, or just my own (through the wifi, for example).
The option that sets the listen interface can be added in /etc/default/prometheus-node-exporter :
ARGS="--web.listen-address=AA.ZZ.YY.XX:9100"where AA.ZZ.YY.XX is the address of the gateway within my VPN.
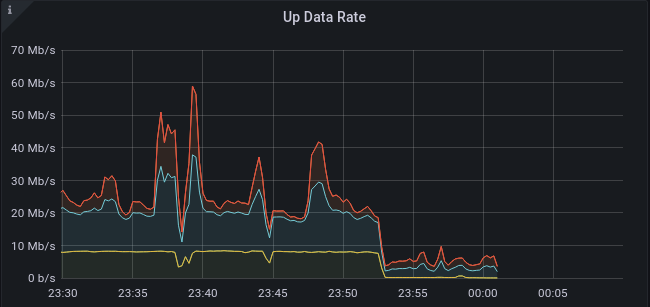
However, upon next rebooting the raspberry pi, I was presented with this :

No logs! Tragedy! Prometheus’ node exporter did not come online. This happened :
level=error ts=[...] caller=node_exporter.go:198 err="listen tcp AA.ZZ.YY.XX:9100: bind: cannot assign requested address"Clearly the problems appear to be that the systemd unit starting prometheus-node-exporter is not written to expect my wireguard interface before starting itself.
## The solution
My wireguard interface is configured and raised automatically at boot thanks to a service called wg-quick, with the specific target wg-quick@iiiii.service where iiiii is the name of my VPN interface.
Running systemctl status prometheus-node-exporter shows you that prometheus node exporter failed to start, but it also gives you the location of the unit file associated with that service. Open it (as root obviously) and, in the Unit section at the beginning of the file, you may add
After=wg-quick@iiiii.serviceThen you can reload systemd’s units (systemctl daemon-reload) and reboot/restart the unit. (Note: a reboot is not required but my issue is with the behaviour on a fresh reboot).
In case your situation is not exactly like mine (you are using different software, or you want to expect an interface not linked to a specific unit), you may want to look at what systemctl list-units --no-pager | grep net-devices shows you. Virtual device services created by systemd might also work in that setup (although I have yet to try that setup).