i don’t think i need to explain to you, dear reader, why web massive web scraping is a pain in the ass. This is not going to be a post as researched or informational as that first one. i’ve been fighting web scrapers as much as i could for almost two years now, and the battle is getting tough.
Some tools, like Iocaine (thanks Algernon for the work you put into it) help a lot by at least sparing my backend from gratuitous amounts of requests (sometimes multiple dozens per second, each completely random). In the past months, however, i’ve seen the bottleneck shift. The web scapers keep happily feeding on garbage, and come back for more, so much so that they actually choke the single CPU on my VPS JUST to generate and retrieve that garbage. People much smarter than i am are trying to make the “poison trap” part of the pipeline as efficient as possible, so that we are not literally burning infrastructure generating nonsense and responding to web queries, but it is inevitable that, at some point, we have to block stuff.
On April 24th 2026, i saw the worst continuous wave of scraping ever on my infrastructure. My VPS (a puny 1vCPU with 200Mbps of bandwidth) sustained a continuous 3k req/min (~50 requests per second) for more than 24 hours. As i write and prepare to publish this, an even worse wave sustained at more than 4k req/min is paralyzing my whole infrastructure.
My line of defense until now had been to block:
- The entire AS of Alibaba (AS45102);
- The entire AS of Huawei Clouds (AS136907);
- The entire AS of Liasail (AS153671);
- The entire AS of Zenlayer (AS21859);
And, more recently:
- Any
/24block i observed hit a URL generated by iocaine within the last hour (using a script that periodically refreshed that list);
On that day, the script was sluggish. i ran it manually, and it took fifteen minutes to send all the /24 blocks to the kernel.
What was going on exactly?
Well… This was going on:
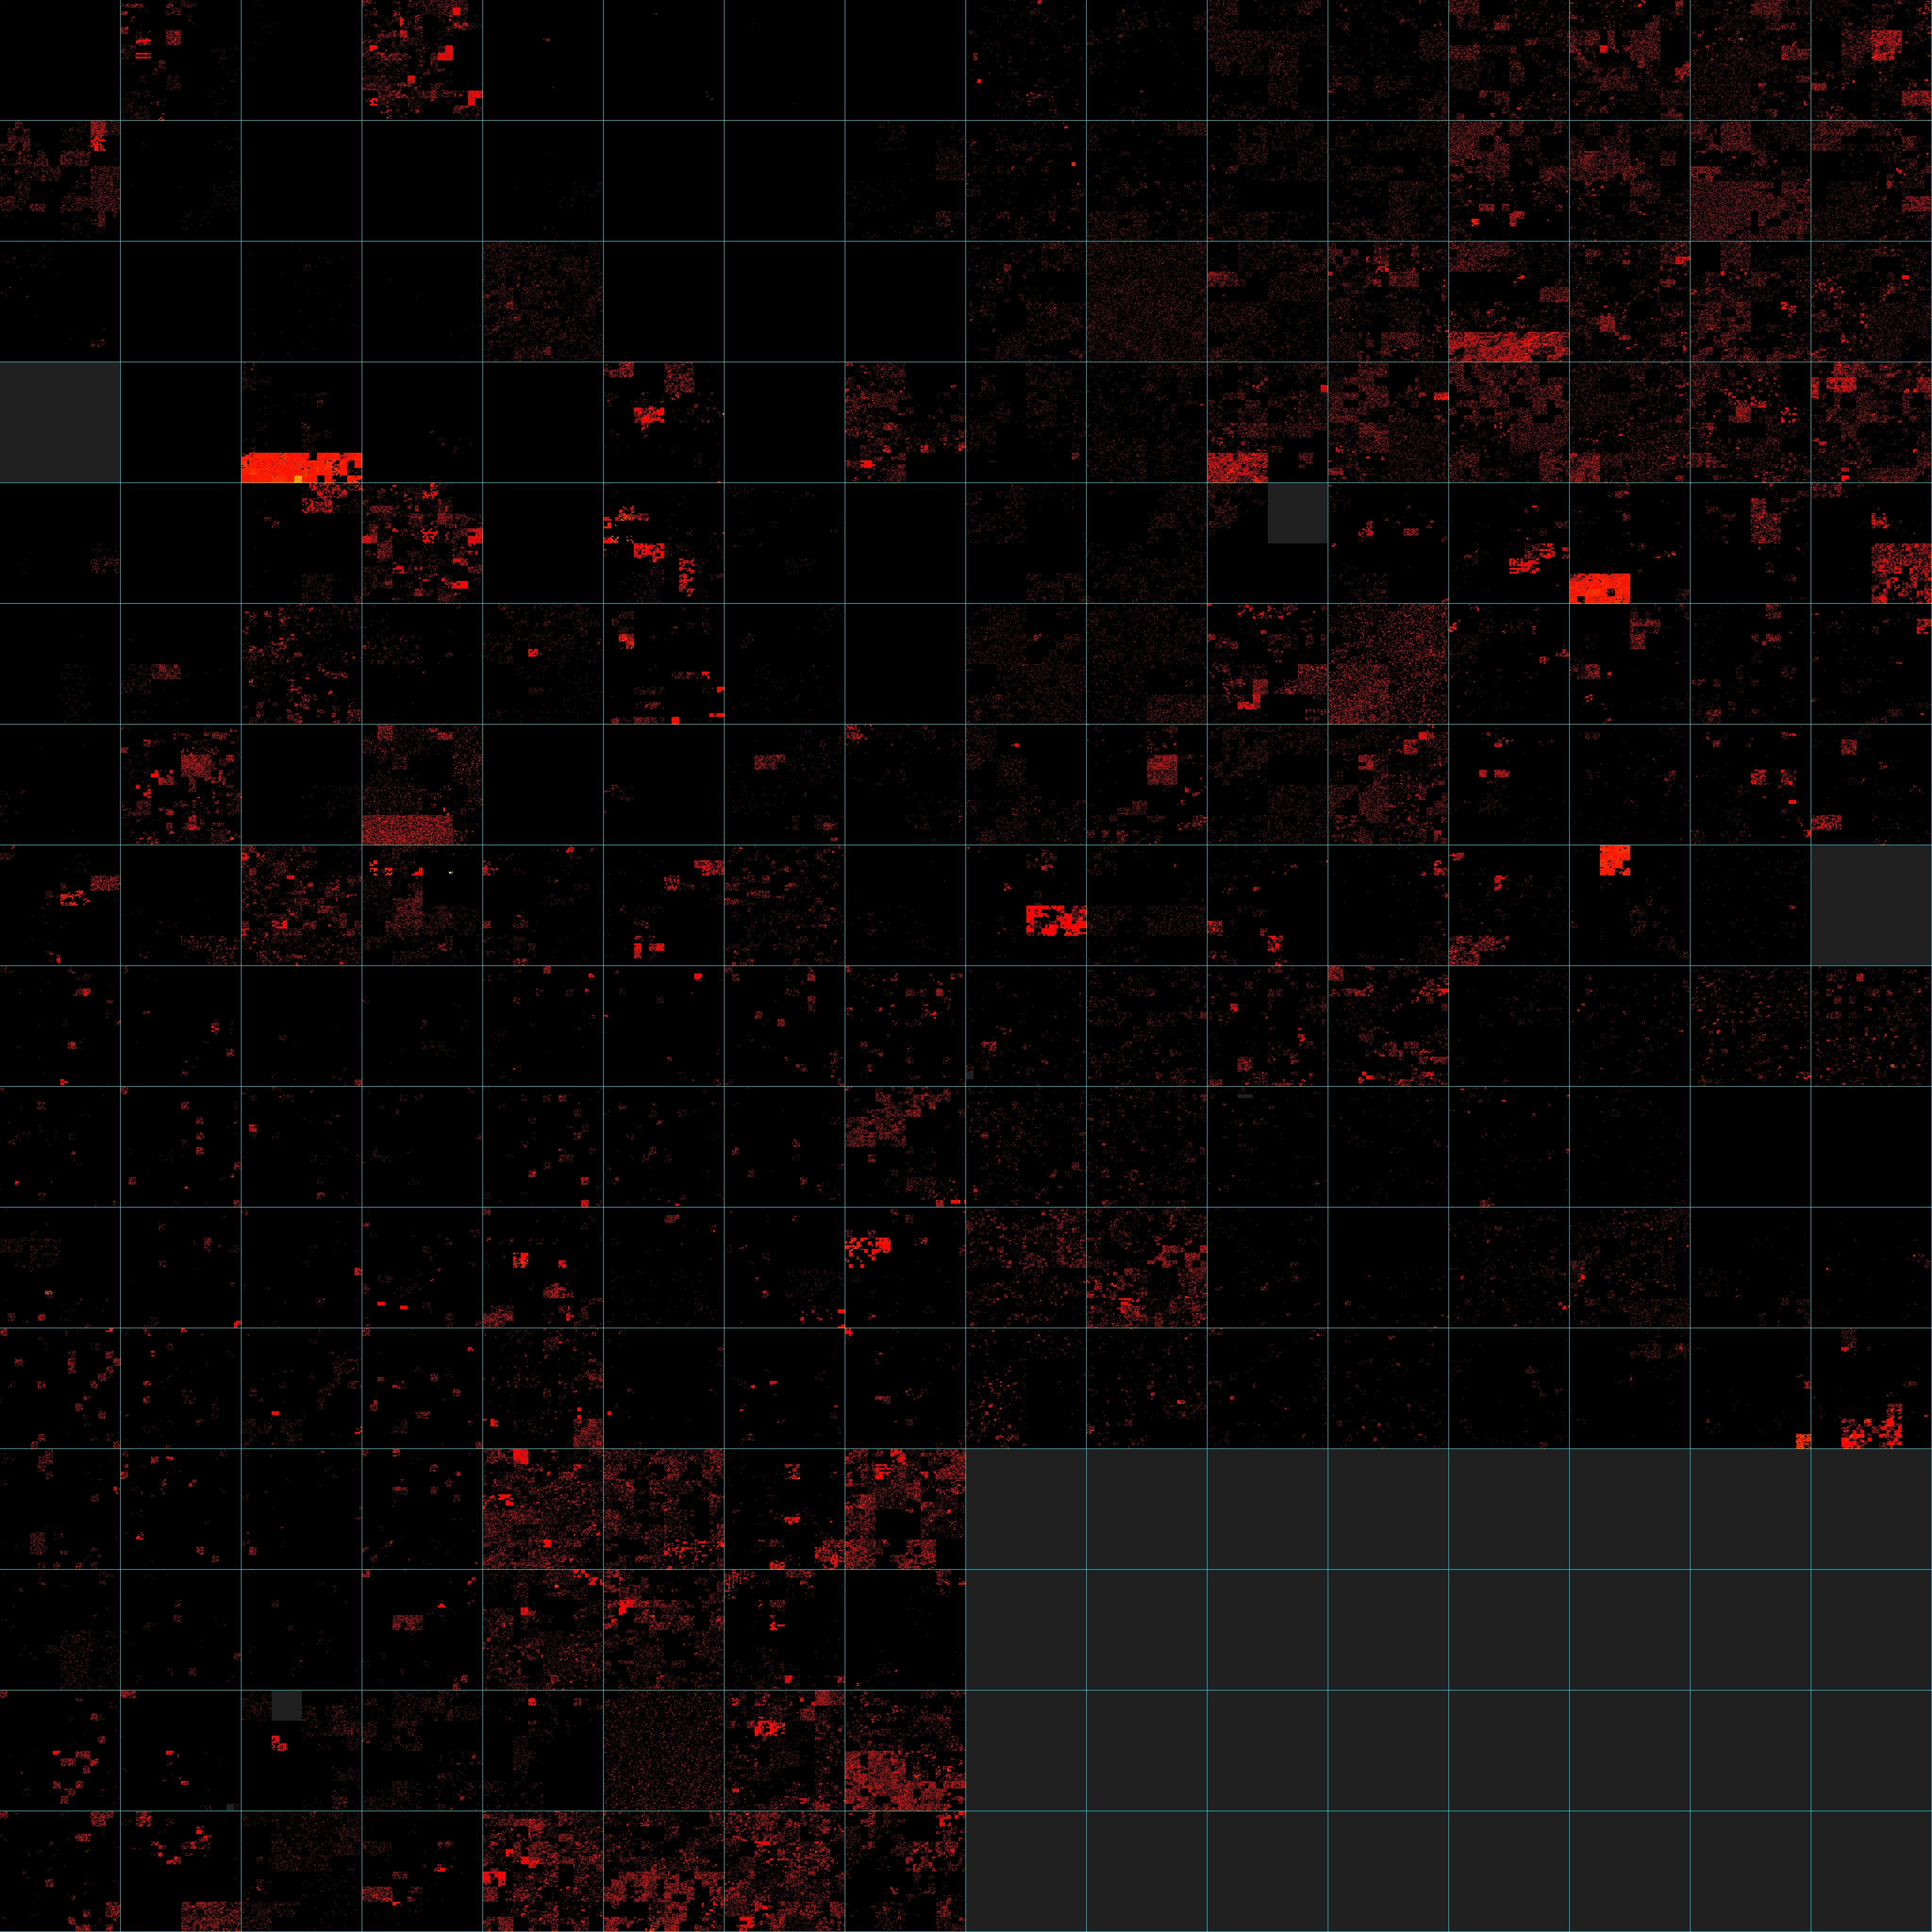
What you’re seeing here is the entire IPv4 address space, from 0.0.0.0 (top left corner) to 255.255.255.255 (bottom right corner) plotted on a Z-order curve. Every pixel of this image is a single /24 block. The cyan lines separate all of the /8 blocks, and grey parts are non-public IPv4 addresses (documentation, multicast, private, etc).
Every pixel that is red/orange/yellow is a /24 that contains at least a single IPv4 address that, in the span of 24 hours on 2026-04-24, hit my VPS and was classified as a bot by Iocaine’s Nam-Shub-of-Enki classifier. The more yellow a pixel becomes, the more IP addresses in the corresponding /24 blocks were involved in the attack.
To make it more dramatic and instill the point i want to convey, here are some fun metrics: in the span of 24 hours (single day of nginx logs):
- 2,040,670 unique IPs (both v4 and v6) hit either my bookstack or git forge (the two main targets that day).
- 99.77% were IPv4 addresses (2,035,978). Assuming 3,723,100,1601 public IPs exist, that means that one out of every 2,000 public IPv4 address hit me that day.
- 0.23% were IPv6 addresses (4,692).
- These addresses performed 5,009,882 total requests on those two sites that were classified as coming from bots, and probably some more that weren’t.
- Out of all the IPv4 address space, 202 of the 256
/8blocks had at least one IPv4 address classified as a bot. - The IPv4 address that did the most requests was
74.7.227.156with 150,483 requests, followed by66.249.79.170with 80314 requests,66.249.76.238with 10148 requests, and66.249.79.171with 3744 requests.- The latter three are from Google’s network (AS15169), the top heavy-hitter is from Microsoft (AS8075).
- 91.76% of requests were from IPv4 addresses (4,596,940 requests), 8.25% by IPv6 addresses (419,942 requests).
i cannot impress upon you, reader, that this is not only an attack that is coordinated, it is an attack that is distributed.
i run a small set of services, basically only for me and my friends. i am not a hyperscaler, i am not a tech company, i am not even a small platform. i have a git forge where i put the shit i make, and a couple other services where me and my friends backup our files or write our grocery lists. i am not fucking Meta and i cannot scale the fuck up just because OpenAI or Anthropic or Meta or whoever is training a model that weeks wants to suck all the content out of my VPS ONCE MORE until it’s dry.
Now, of course, on a normal day, the background radiation of bot requests looks more like this:
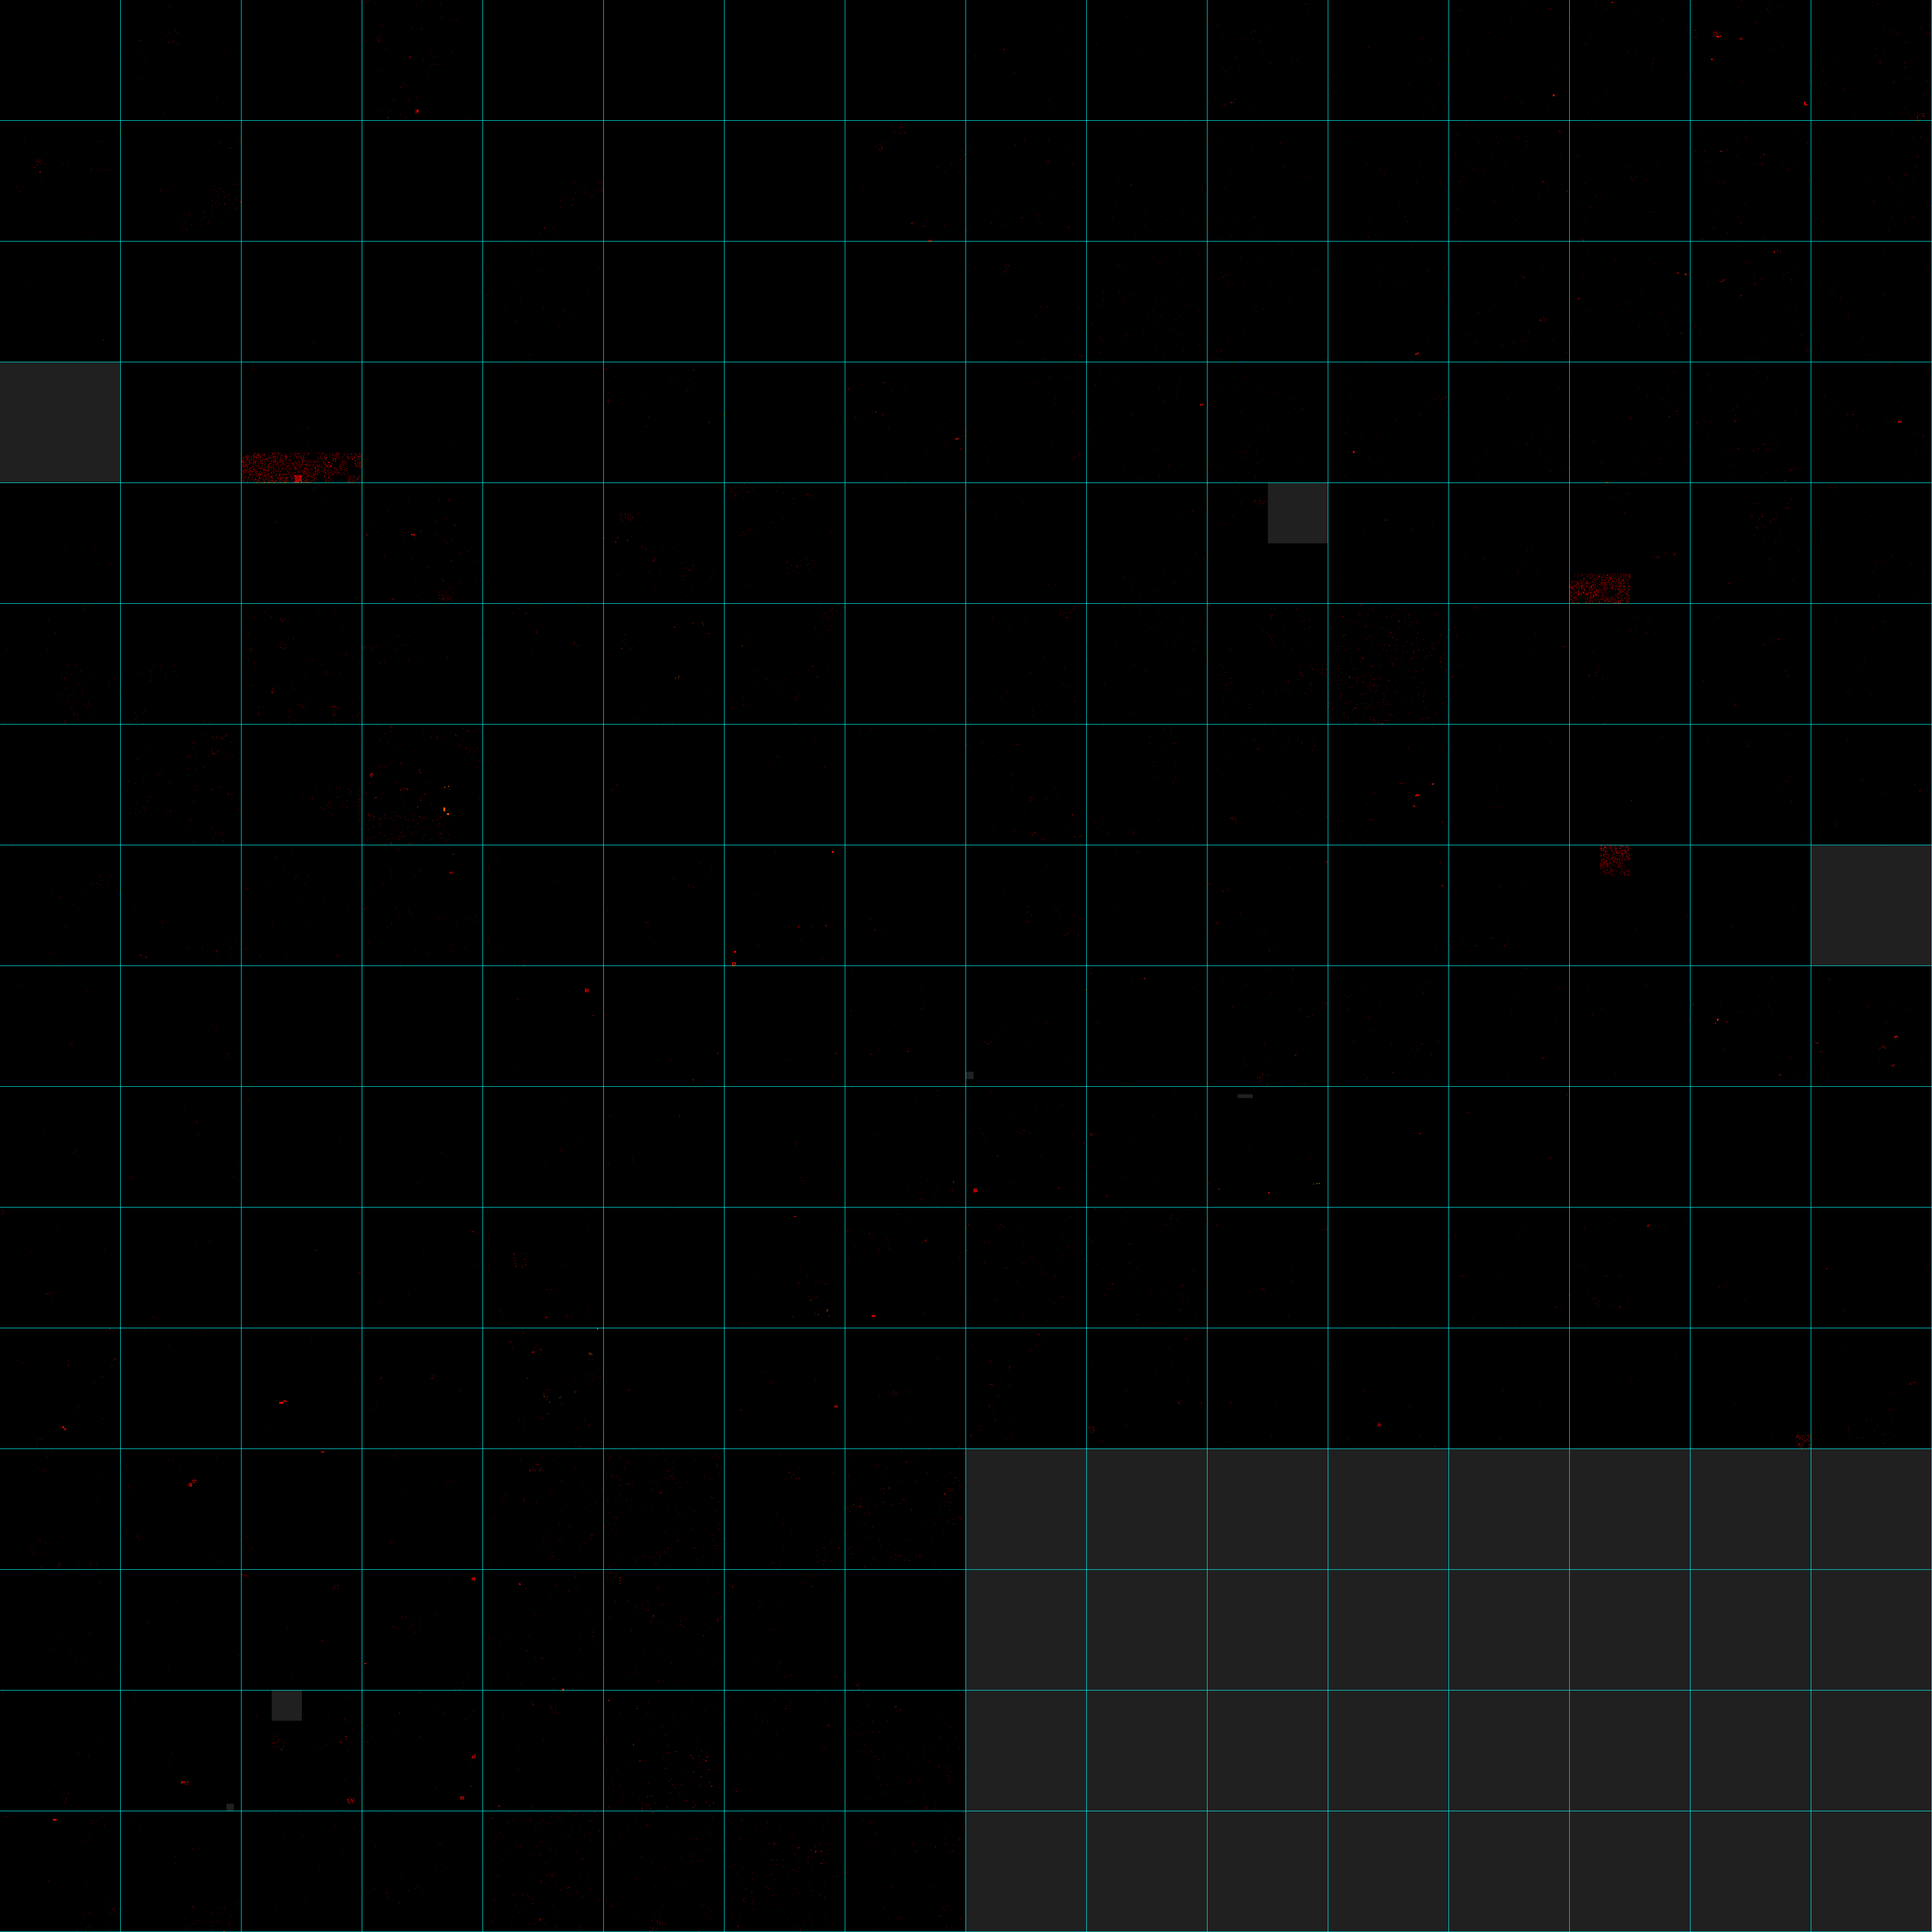
The three visible blobs are all likely from VNPT, a national ISP from Vietnam, about whom i’ve written before. Same for the block at 113.173.0.0/20. Other than them, you see very bright but small groups of pixels on a normal day.
Oh and if you want to generate your own visuals like the one above, here. It’s very simple Rust, it’s not highly configurable, it’ll definitely gain more features. And i know IPv6 is a thing that exists, and IPv6 addresses were definitely involved, at a very small scale in terms of distribution, but still.
Here, have a timelapse from 2026-04-11 to 2026-04-28:

(i removed the grid because it was fucking ugly on firefox, it’s also awful on Chromium don’t worry. Zoom in or download the file to see it in all of its crispy glory.)
On 2026-04-28 at 1755 UTC, my metrics registered a sharp uptick in bots caught fetching fake URLs (that contain a specific trigger word). At the same time, the share of requests classified as bots tanked to below 79%, which never happens. The bots have become better at not getting detected, and they’re hitting my infrastructure hard.
i don’t know how long i can keep doing this for…
-
You can do the math with good old
python:2 ** 32 - 2 ** 20 - 2 ** 24 - 2 ** 24 - 2 * (2 ** 16) - 2 * (2 ** 28) - 2 * (2 ** 17). ↩